Starting out with data, or stuck partway through.
Two situations bring people to us. You are at the beginning and want to get it right. Or you have built something, it is not working, and you need to know why.
We handle both. Data modelling, pipelines, reporting, forecasting, and the connectors into your planning system.
Email usIf you are starting out
You have data in a few systems and a growing pile of spreadsheets. Nobody has designed anything yet.
The expensive mistakes happen here, quietly. Buying a platform before you know what you need. Building reports straight on top of raw system tables. Letting each team decide for itself what an active customer is.
-
We write down what your key numbers mean, and get the people who report them to agree.
-
We work out whether you need a data warehouse at all. Often you do not, yet.
-
We build the smallest thing that answers your top five questions, then stop.
-
We set it up so your team can extend it without calling us.
If you are partway and stuck
The usual version: you have a warehouse, several dashboards, and nobody trusts the numbers. Or a pipeline that breaks and nobody knows why. Or a platform you bought two years ago that never got finished.
We start by finding out what is actually there.
-
We read the models, the pipelines and the reports. Two weeks is usually enough to know what is wrong.
-
We separate the problems worth fixing from the ones worth deleting.
-
You get a written plan: what to fix first, what it costs, and what to leave alone.
-
Then we fix it, or you hand the plan to your own team. Either is fine.
The work itself
Designing the tables your reports read from, and writing down what one row means in each, so the same question gives the same answer everywhere.
Moving data out of your systems into one place on a schedule, with alerts when a load fails and a documented way to rerun it.
Board packs, dashboards and scheduled reports, all reading the same numbers from the same place.
Loading Workday Adaptive, Anaplan or TM1 from your systems automatically. More on that.
Written down and handed over, so your team can run it and change it after we leave.
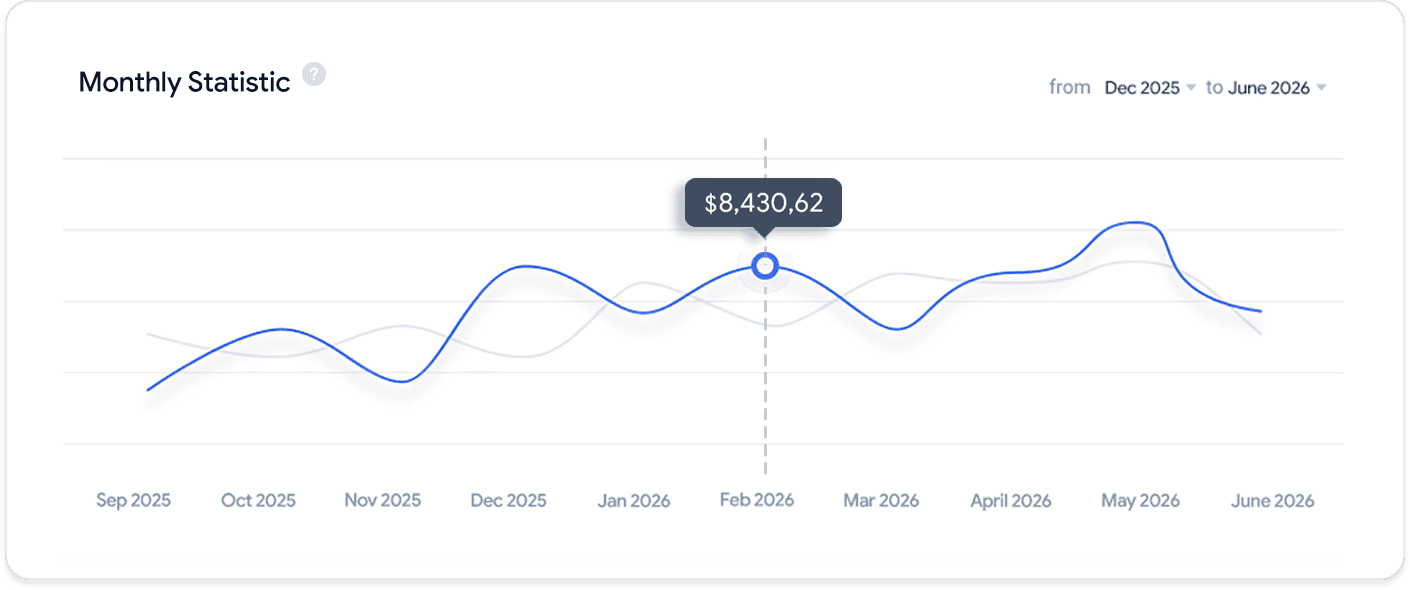
Forecasts off the same numbers as your actuals
So the two never disagree. No parallel spreadsheet, no re-keyed extract.
-
Forecasts built from what actually moves the number: headcount, price, volume. Not last year plus ten percent.
-
Base, upside and downside cases from one model. Change an assumption and see what moves.
-
Each period we compare the forecast against what happened, and attribute the gap to a specific driver.
-
A twelve to eighteen month view that refreshes on a schedule instead of being rebuilt every quarter.
Common questions
Four that come up early.
-
Do we need a data warehouse?
Not always. If your reporting reads one system and the volumes are modest, a set of well written database views and a scheduled export can be right for years.
We tell you that before you buy anything.
-
Which tools do you work with?
Whatever you already run, in most cases. The tool matters less than the design underneath it, and switching costs more than it returns unless something is genuinely blocking you.
-
We want to do AI. Should we do this first?
Usually yes. A model trained on data nobody agreed the meaning of inherits the disagreement and then hides it behind a confident answer.
It is also the cheaper half, and it keeps paying off whether or not the AI work goes ahead.
-
How long before we see something?
The definitions produce a document in two to three weeks. A first working report usually follows within a month.
Getting access to source systems is the common delay, so start that paperwork on day one.